Do You Support Your Local Team? I Have Proof.
THERE IS AN INTERACTIVE VERSION OF ALL OF THE MAPS SHOWN HERE
Every now and then in my days supporting and following Cardiff City, we got to play one of the so-called “big clubs”, maybe in the FA cup or in the couple of seasons that we spent in the Premier League. One chant was consistent through all of those usually miserable days: “WE SUPPORT OUR LOCAL TEAM!”. It’s a terrible chant, was the only thing we could possibly have over a “big” club a weak moral high-ground? And I often thought, was it even true? Surely a lot of the accents around me belonged to people who lived slightly closer to Newport? Obviously, if we took into account all the football clubs in the UK, almost no-one would support their local team and there would be a lot more fans of Hampton & Richmond Borough, Slough Town, or Swansea City, for example.
Well, I’ve set out to see if everyone in the UK had to support their “local team”, who would they support? I’ve looked at 104 in the UK, the 92 teams from the EFL and the Premier League, as well as the 12 teams of the Scottish Premiership. Using a series of maps and a visualisation technique called a Voronoi Tessellation, I can show the areas that are closest to each club. Most notably, there are no clubs represented in Northern Ireland, and so usually one team takes over the whole country, and only the top 12 clubs in Scotland, meaning that quite large areas will be represented by these sides.
The Premier League in The UK
Firstly, if everyone in the UK had to support their “local” premier league side, who would they support?
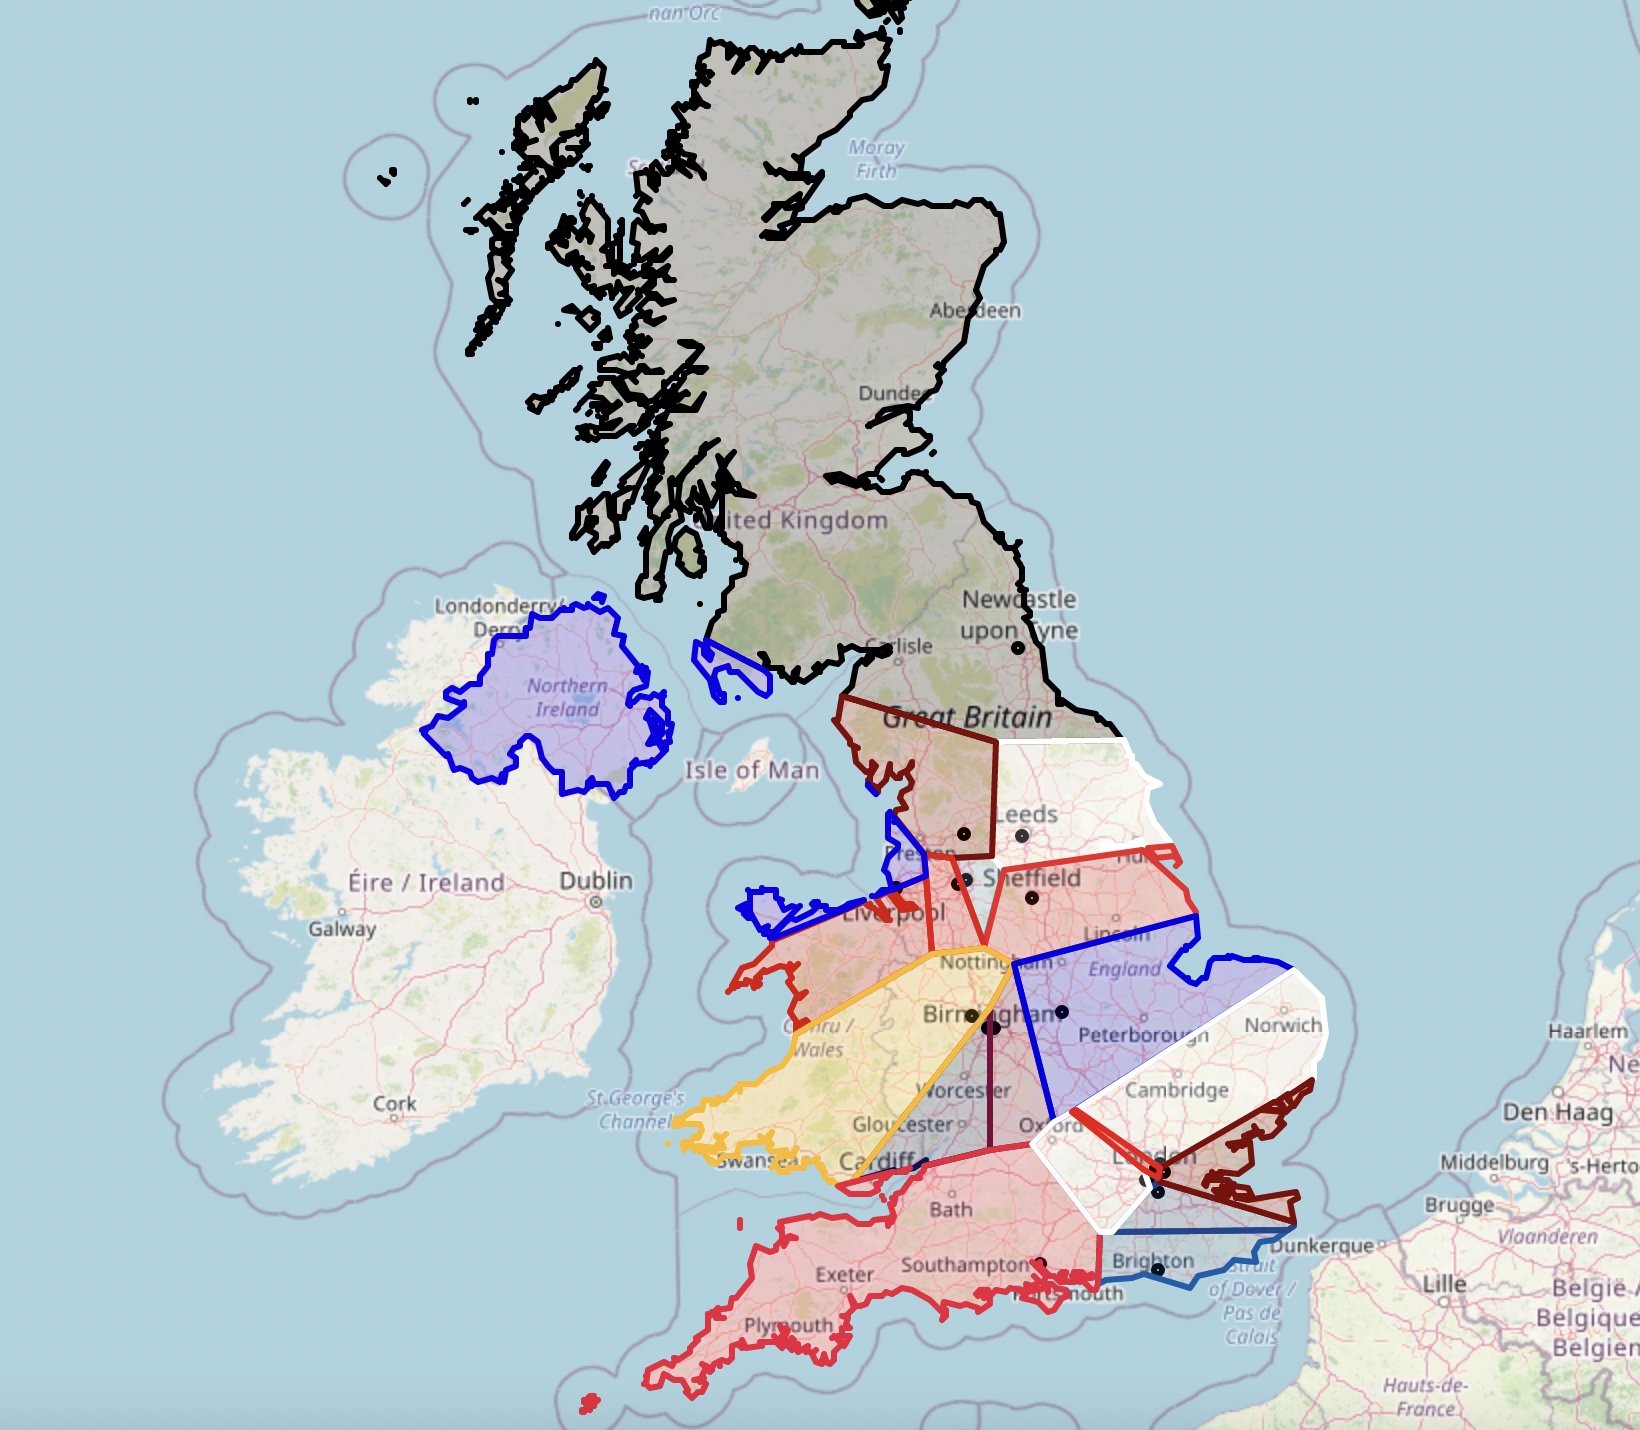 UK’s Local Premier League Sides
For anyone in Northern Ireland, and Ynys Môn, it’s got to be Everton for you, and anyone in the whole of Scotland has to support Newcastle United. The most widely supported London club would be Tottenham Hotspur, whose influence expands all the way to Norwich and beyond. Southampton do well, covering all of Cornwall and the south west, and Wolves take nearly all of Wales.
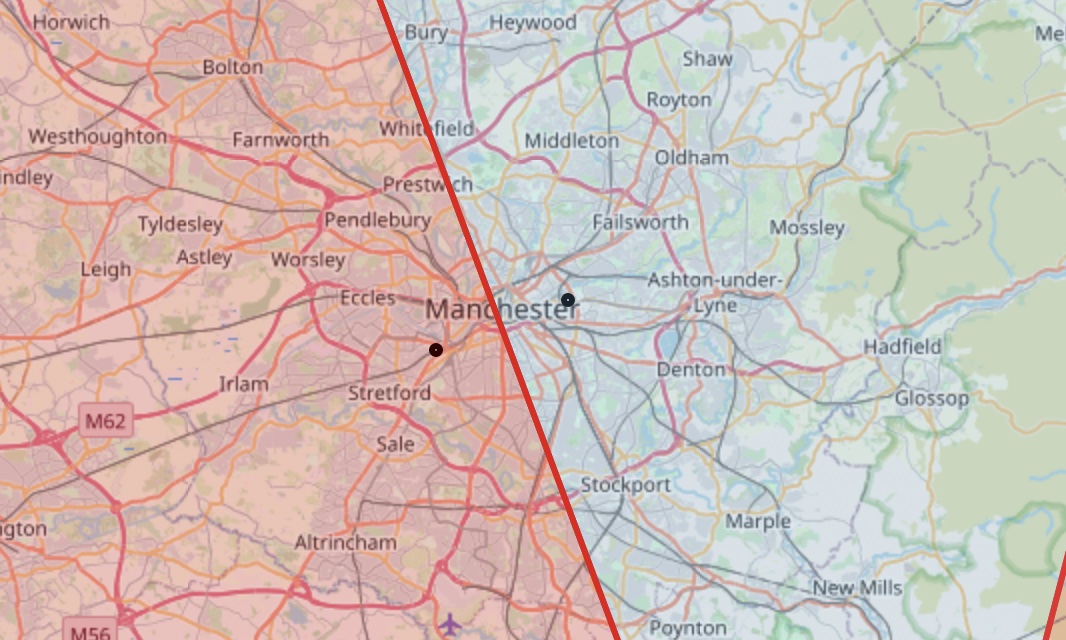 Manchester Split Down the Middle
Manchester is split almost perfectly down the middle and the smallest area that a club represents is this one in London belonging to the minnows of Chelsea.
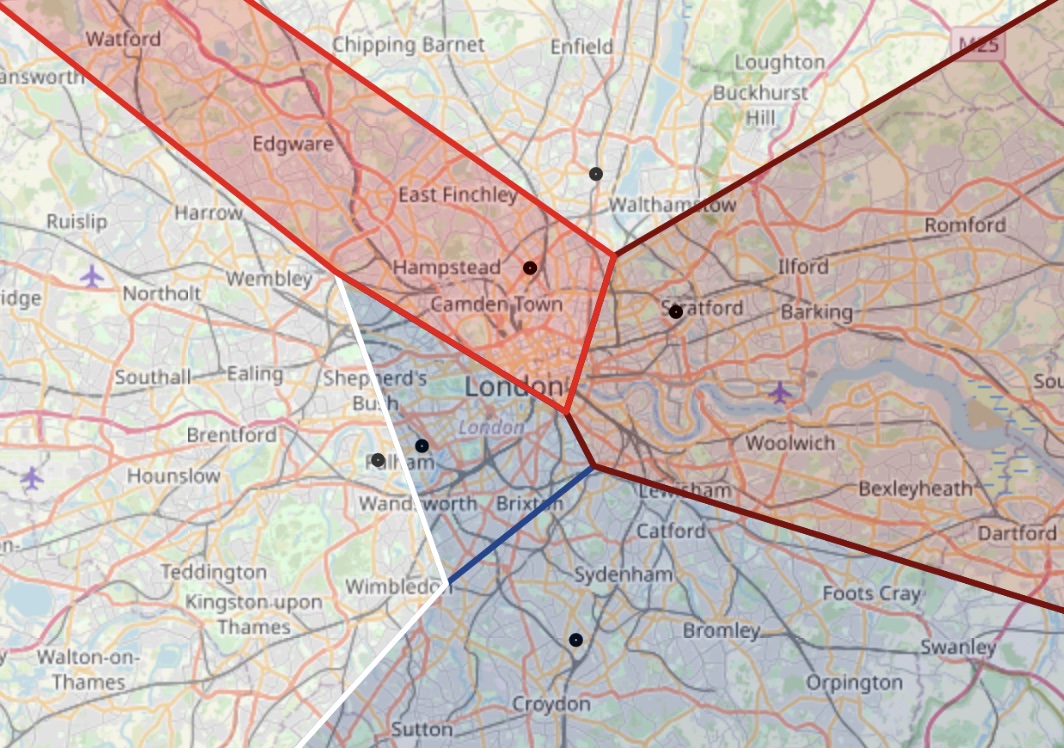 Chelsea Surrounded
Other UK Teams
Now this is a good place to start, but I wanted more depth in my search for the largest local club in the UK (if that makes sense). So, I went for it. I gathered the geographical data for all 72 English Football League clubs and the 12 teams in the Scottish premiership. Take a look (all the colours are the team’s colours):
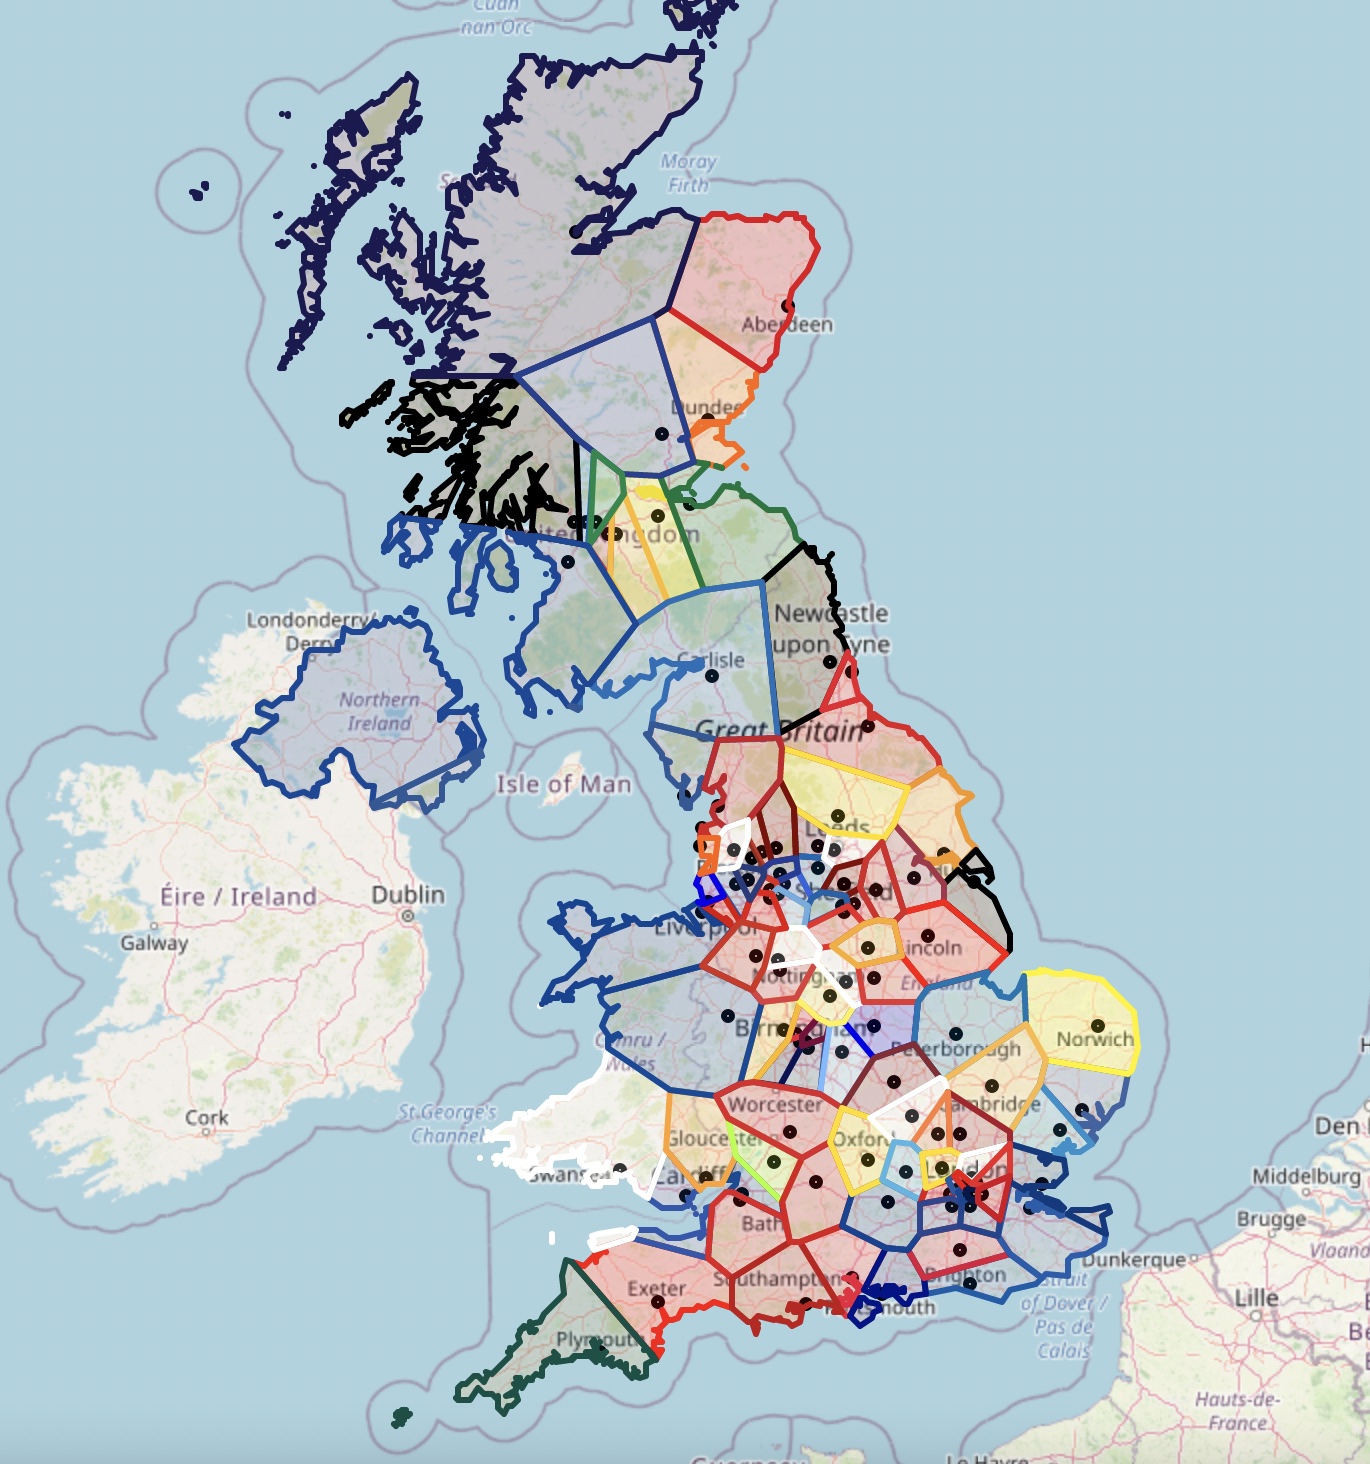 UK’s Local Teams
This is a lot to take in, and there is so much to describe that it’s best that you take a look yourself. There is an interactive version of all the maps shown plus a few more here.
So, instead of describing this map I decided to come up with a better measure of representation and produce an alternative league table for my big UK Super League (I wrote this article before the announcement of the European Super League). I didn’t include Northern Ireland in this calculation as I didn’t think it was fair. Also, the areas shown in this table may be slightly different to the ones shown on the map and so teams that appear smaller on the map may be bigger in the league table. This is because of the way the areas are projected onto the earth (don’t ask - it was a massive headache figuring this out). This is a very large table showing the area that all of the teams above represent, how well does your team do?
| Club | Area (KM2) | % | |
|---|---|---|---|
| 1 | Ross County F.C. | 30765 | 13.37 |
| 2 | Carlisle United | 9294 | 4.04 |
| 3 | St Mirren F.C. | 8281 | 3.6 |
| 4 | Shrewsbury Town | 8255 | 3.59 |
| 5 | Swansea City A.F.C. | 8028 | 3.49 |
| 6 | Kilmarnock F.C. | 7643 | 3.32 |
| 7 | St Johnstone F.C. | 7058 | 3.07 |
| 8 | Aberdeen F.C. | 6960 | 3.03 |
| 9 | Plymouth Argyle | 5697 | 2.48 |
| 10 | Exeter City | 5554 | 2.41 |
| 11 | Newcastle United F.C. | 5180 | 2.25 |
| 12 | Tranmere Rovers | 5073 | 2.21 |
| 13 | Norwich City | 4963 | 2.16 |
| 14 | Hibernian F.C. | 4432 | 1.93 |
| 15 | Peterborough United | 4229 | 1.84 |
| 16 | Middlesbrough | 4023 | 1.75 |
| 17 | Dundee United F.C. | 3832 | 1.67 |
| 18 | Harrogate Town | 3578 | 1.56 |
| 19 | Cheltenham Town | 3325 | 1.45 |
| 20 | Cambridge United | 3301 | 1.43 |
| 21 | Gillingham | 3238 | 1.41 |
| 22 | Lincoln City | 3212 | 1.4 |
| 23 | A.F.C. Bournemouth | 3140 | 1.36 |
| 24 | Newport County | 2939 | 1.28 |
| 25 | Bristol City | 2739 | 1.19 |
| 26 | Swindon Town | 2731 | 1.19 |
| 27 | Hull City | 2620 | 1.14 |
| 28 | Morecambe | 2516 | 1.09 |
| 29 | Livingston F.C. | 2327 | 1.01 |
| 30 | Reading | 2279 | 0.99 |
| 31 | Southampton F.C. | 2261 | 0.98 |
| 32 | Ipswich Town | 2203 | 0.96 |
| 33 | Northampton Town | 2117 | 0.92 |
| 34 | Oxford United | 1946 | 0.85 |
| 35 | Crawley Town | 1936 | 0.84 |
| 36 | Motherwell F.C. | 1893 | 0.82 |
| 37 | Colchester United | 1785 | 0.78 |
| 38 | Brighton & Hove Albion F.C. | 1752 | 0.76 |
| 39 | Cardiff City | 1722 | 0.75 |
| 40 | Leicester City F.C. | 1667 | 0.72 |
| 41 | Grimsby Town | 1584 | 0.69 |
| 42 | Coventry City | 1584 | 0.69 |
| 43 | Crewe Alexandra | 1535 | 0.67 |
| 44 | Portsmouth | 1512 | 0.66 |
| 45 | Forest Green Rovers | 1508 | 0.66 |
| 46 | Scunthorpe United | 1468 | 0.64 |
| 47 | Barrow | 1453 | 0.63 |
| 48 | Wolverhampton Wanderers F.C. | 1434 | 0.62 |
| 49 | Southend United | 1384 | 0.6 |
| 50 | Milton Keynes Dons | 1381 | 0.6 |
| 51 | Stevenage | 1341 | 0.58 |
| 52 | Nottingham Forest | 1288 | 0.56 |
| 53 | Mansfield Town | 1096 | 0.48 |
| 54 | Burnley F.C. | 1096 | 0.48 |
| 55 | Doncaster Rovers | 1067 | 0.46 |
| 56 | Burton Albion | 1040 | 0.45 |
| 57 | Wycombe Wanderers | 957 | 0.42 |
| 58 | Stoke City F.C. | 944 | 0.41 |
| 59 | Port Vale | 841 | 0.37 |
| 60 | Birmingham City | 832 | 0.36 |
| 61 | Celtic F.C. | 830 | 0.36 |
| 62 | Derby County | 829 | 0.36 |
| 63 | Bristol Rovers | 773 | 0.34 |
| 64 | Leeds United F.C. | 746 | 0.32 |
| 65 | Sheffield United F.C. | 720 | 0.31 |
| 66 | Luton Town | 716 | 0.31 |
| 67 | AFC Wimbledon | 692 | 0.3 |
| 68 | Rangers F.C. | 622 | 0.27 |
| 69 | Bradford City | 606 | 0.26 |
| 70 | Preston North End | 604 | 0.26 |
| 71 | Watford | 600 | 0.26 |
| 72 | Manchester United F.C. | 569 | 0.25 |
| 73 | West Bromwich Albion F.C. | 568 | 0.25 |
| 74 | Crystal Palace F.C. | 562 | 0.24 |
| 75 | Wigan Athletic | 557 | 0.24 |
| 76 | Huddersfield Town | 549 | 0.24 |
| 77 | Barnsley | 507 | 0.22 |
| 78 | Sunderland | 492 | 0.21 |
| 79 | Manchester City F.C. | 476 | 0.21 |
| 80 | Charlton Athletic | 472 | 0.21 |
| 81 | Tottenham Hotspur F.C. | 464 | 0.2 |
| 82 | Sheffield Wednesday | 436 | 0.19 |
| 83 | Leyton Orient | 403 | 0.18 |
| 84 | Hamilton Academical F.C. | 381 | 0.17 |
| 85 | Accrington Stanley | 356 | 0.15 |
| 86 | Rotherham United | 323 | 0.14 |
| 87 | Oldham Athletic | 316 | 0.14 |
| 88 | Walsall | 311 | 0.14 |
| 89 | Brentford | 304 | 0.13 |
| 90 | Rochdale | 297 | 0.13 |
| 91 | Everton F.C. | 280 | 0.12 |
| 92 | Liverpool F.C. | 270 | 0.12 |
| 93 | Bolton Wanderers | 262 | 0.11 |
| 94 | Aston Villa F.C. | 237 | 0.1 |
| 95 | Blackpool | 234 | 0.1 |
| 96 | Blackburn Rovers | 221 | 0.1 |
| 97 | Fleetwood Town | 151 | 0.07 |
| 98 | Salford City | 132 | 0.06 |
| 99 | Arsenal F.C. | 90 | 0.04 |
| 100 | Queens Park Rangers | 80 | 0.03 |
| 101 | Millwall | 61 | 0.03 |
| 102 | Chelsea F.C. | 47 | 0.02 |
| 103 | West Ham United F.C. | 34 | 0.01 |
| 104 | Fulham F.C. | 32 | 0.01 |
The undisputed champions of this league are the mighty Ross County, probably owing to their control of the entirety of the Highlands and Islands. They not only win this league, but win it by a HUGE majority. Their influence expands over 30,000 KM2, or ~13% of Great Britain. Interestingly, in this measure, some of the “big clubs” perform poorly - maybe good teams tend to be closer together, and therefore can not represent as large an area as others? Swansea City just nip in to the “Europa League places” in 5th, with an unlikely 4th place finish from Shrewsbury Town. The Bottom 6 clubs are all in London, owing to the high density of clubs in the capital.
This is obvioulsy a bizarre measure, and just an interesting way of seeing “local teams” in the UK. What would be really interesting is if we could find out the population density within these areas, and therefore find how many fans each team would have if everyone in the UK was bound to their “local” club. I could write a whole other article about how I made these graphs, how I find the data, how to project these areas onto the earth, how to calculate the area of the areas shown. It was a minefield. But I hope that the results are interesting.
Explore these maps, there is an interactive version of all the maps shown (plus a few more) here.
